

OUR SERVICES
ORE Catapult enables innovation and accelerates the development of offshore renewable energy, growing businesses and creating jobs throughout the UK.
Established in 2013, we exist to accelerate the development of offshore wind, wave and tidal energy technologies in the UK.
Through our world-class testing and research programmes and our unique centres of excellence, we work with industry, academia and government to improve technology reliability and enhance knowledge, directly impacting the cost of offshore renewable energy.
We deliver products and services in four main areas:
RESEARCH

ENGINEERING
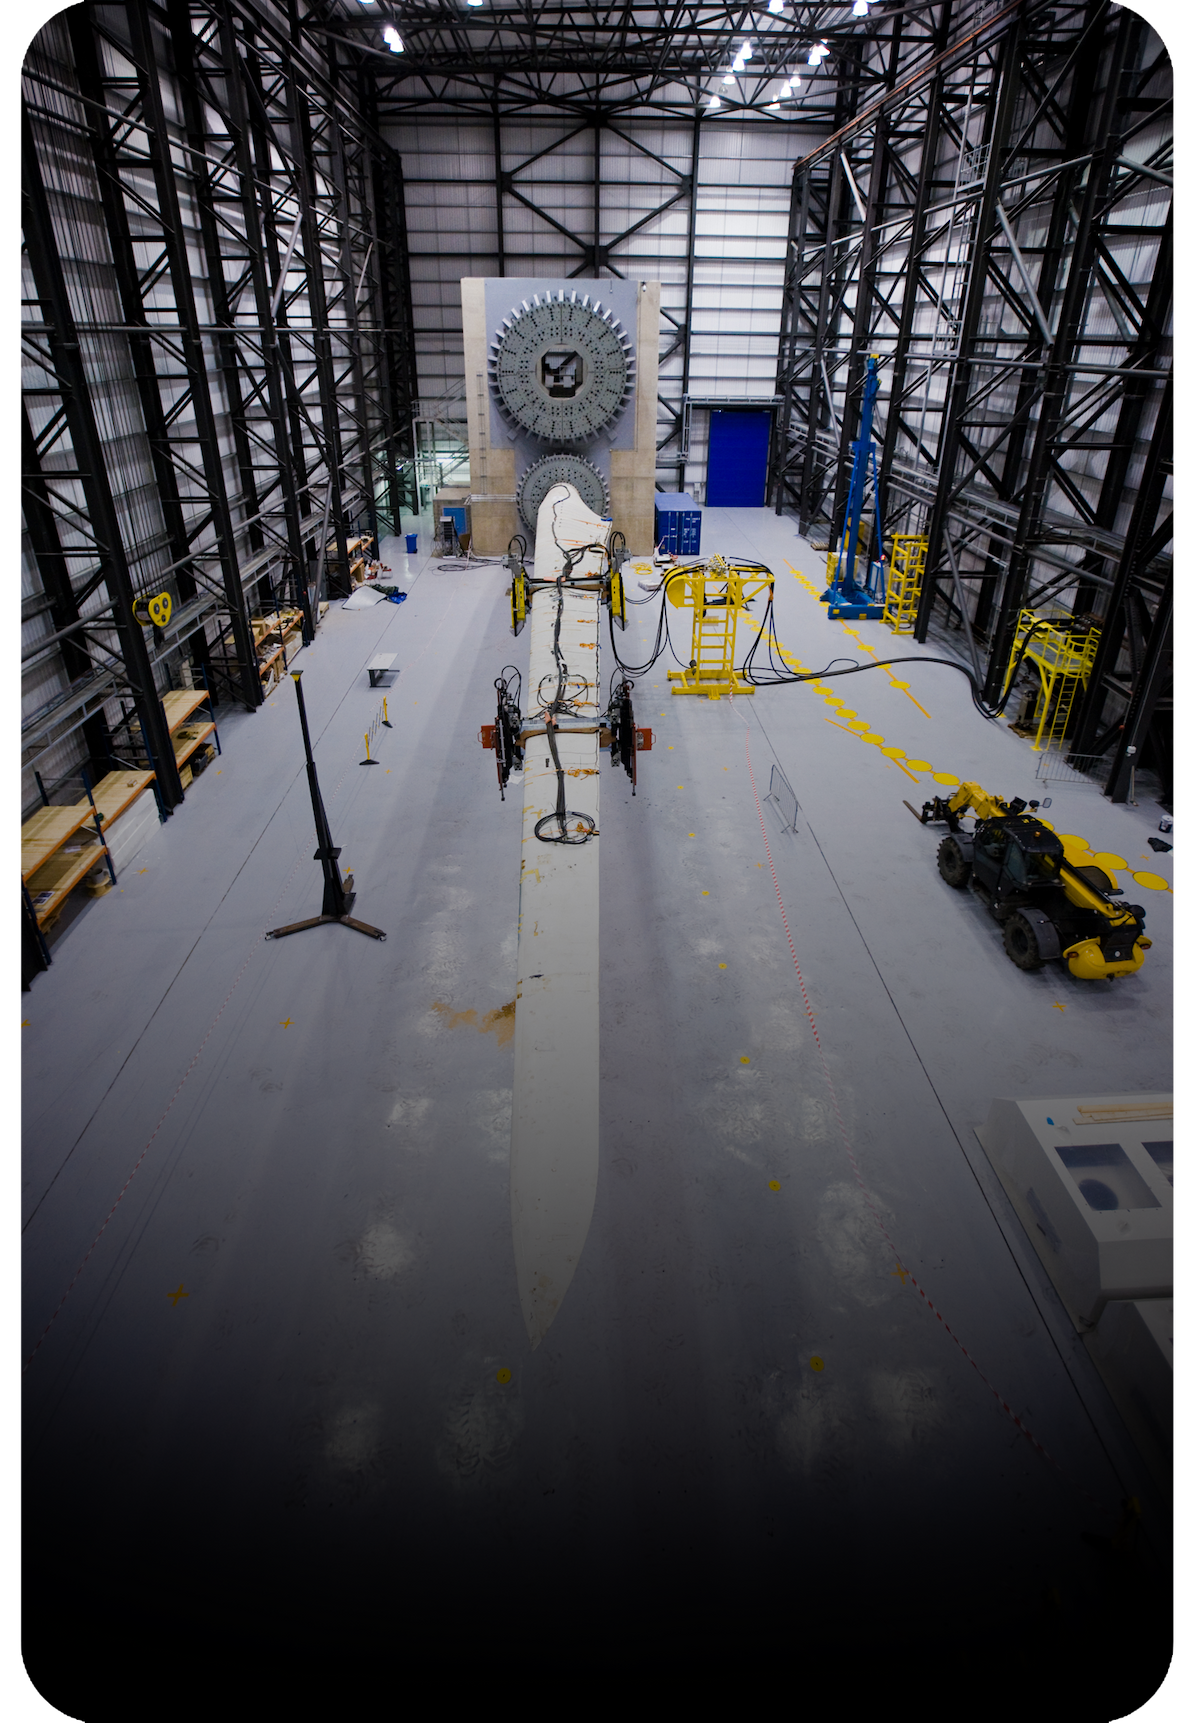
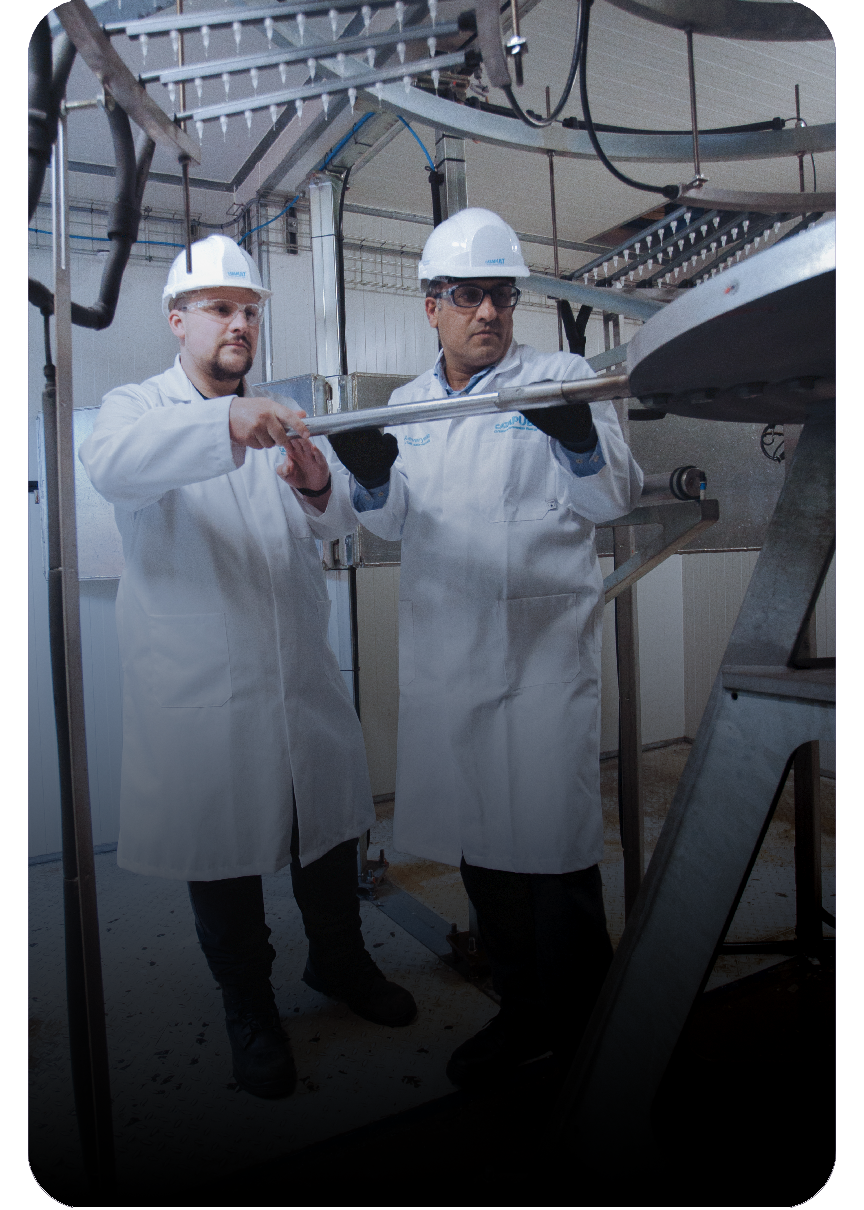
TESTING & VALIDATION
SUPPLY CHAIN GROWTH
WHAT CAN WE DO FOR YOU?
OUR LOCATIONS ACROSS THE UK
Take a look at our location fly-through to see our eight locations across the UK, from our FLOWIC facility in Aberdeen to our offices and support teams in Pembroke Dock and Hayle.
FOCUS ON SUPPLY CHAIN
At ORE Catapult, we have multiple funding programmes for those either looking to enter the offshore wind supply chain or those with an innovative technology or product looking for help to develop:
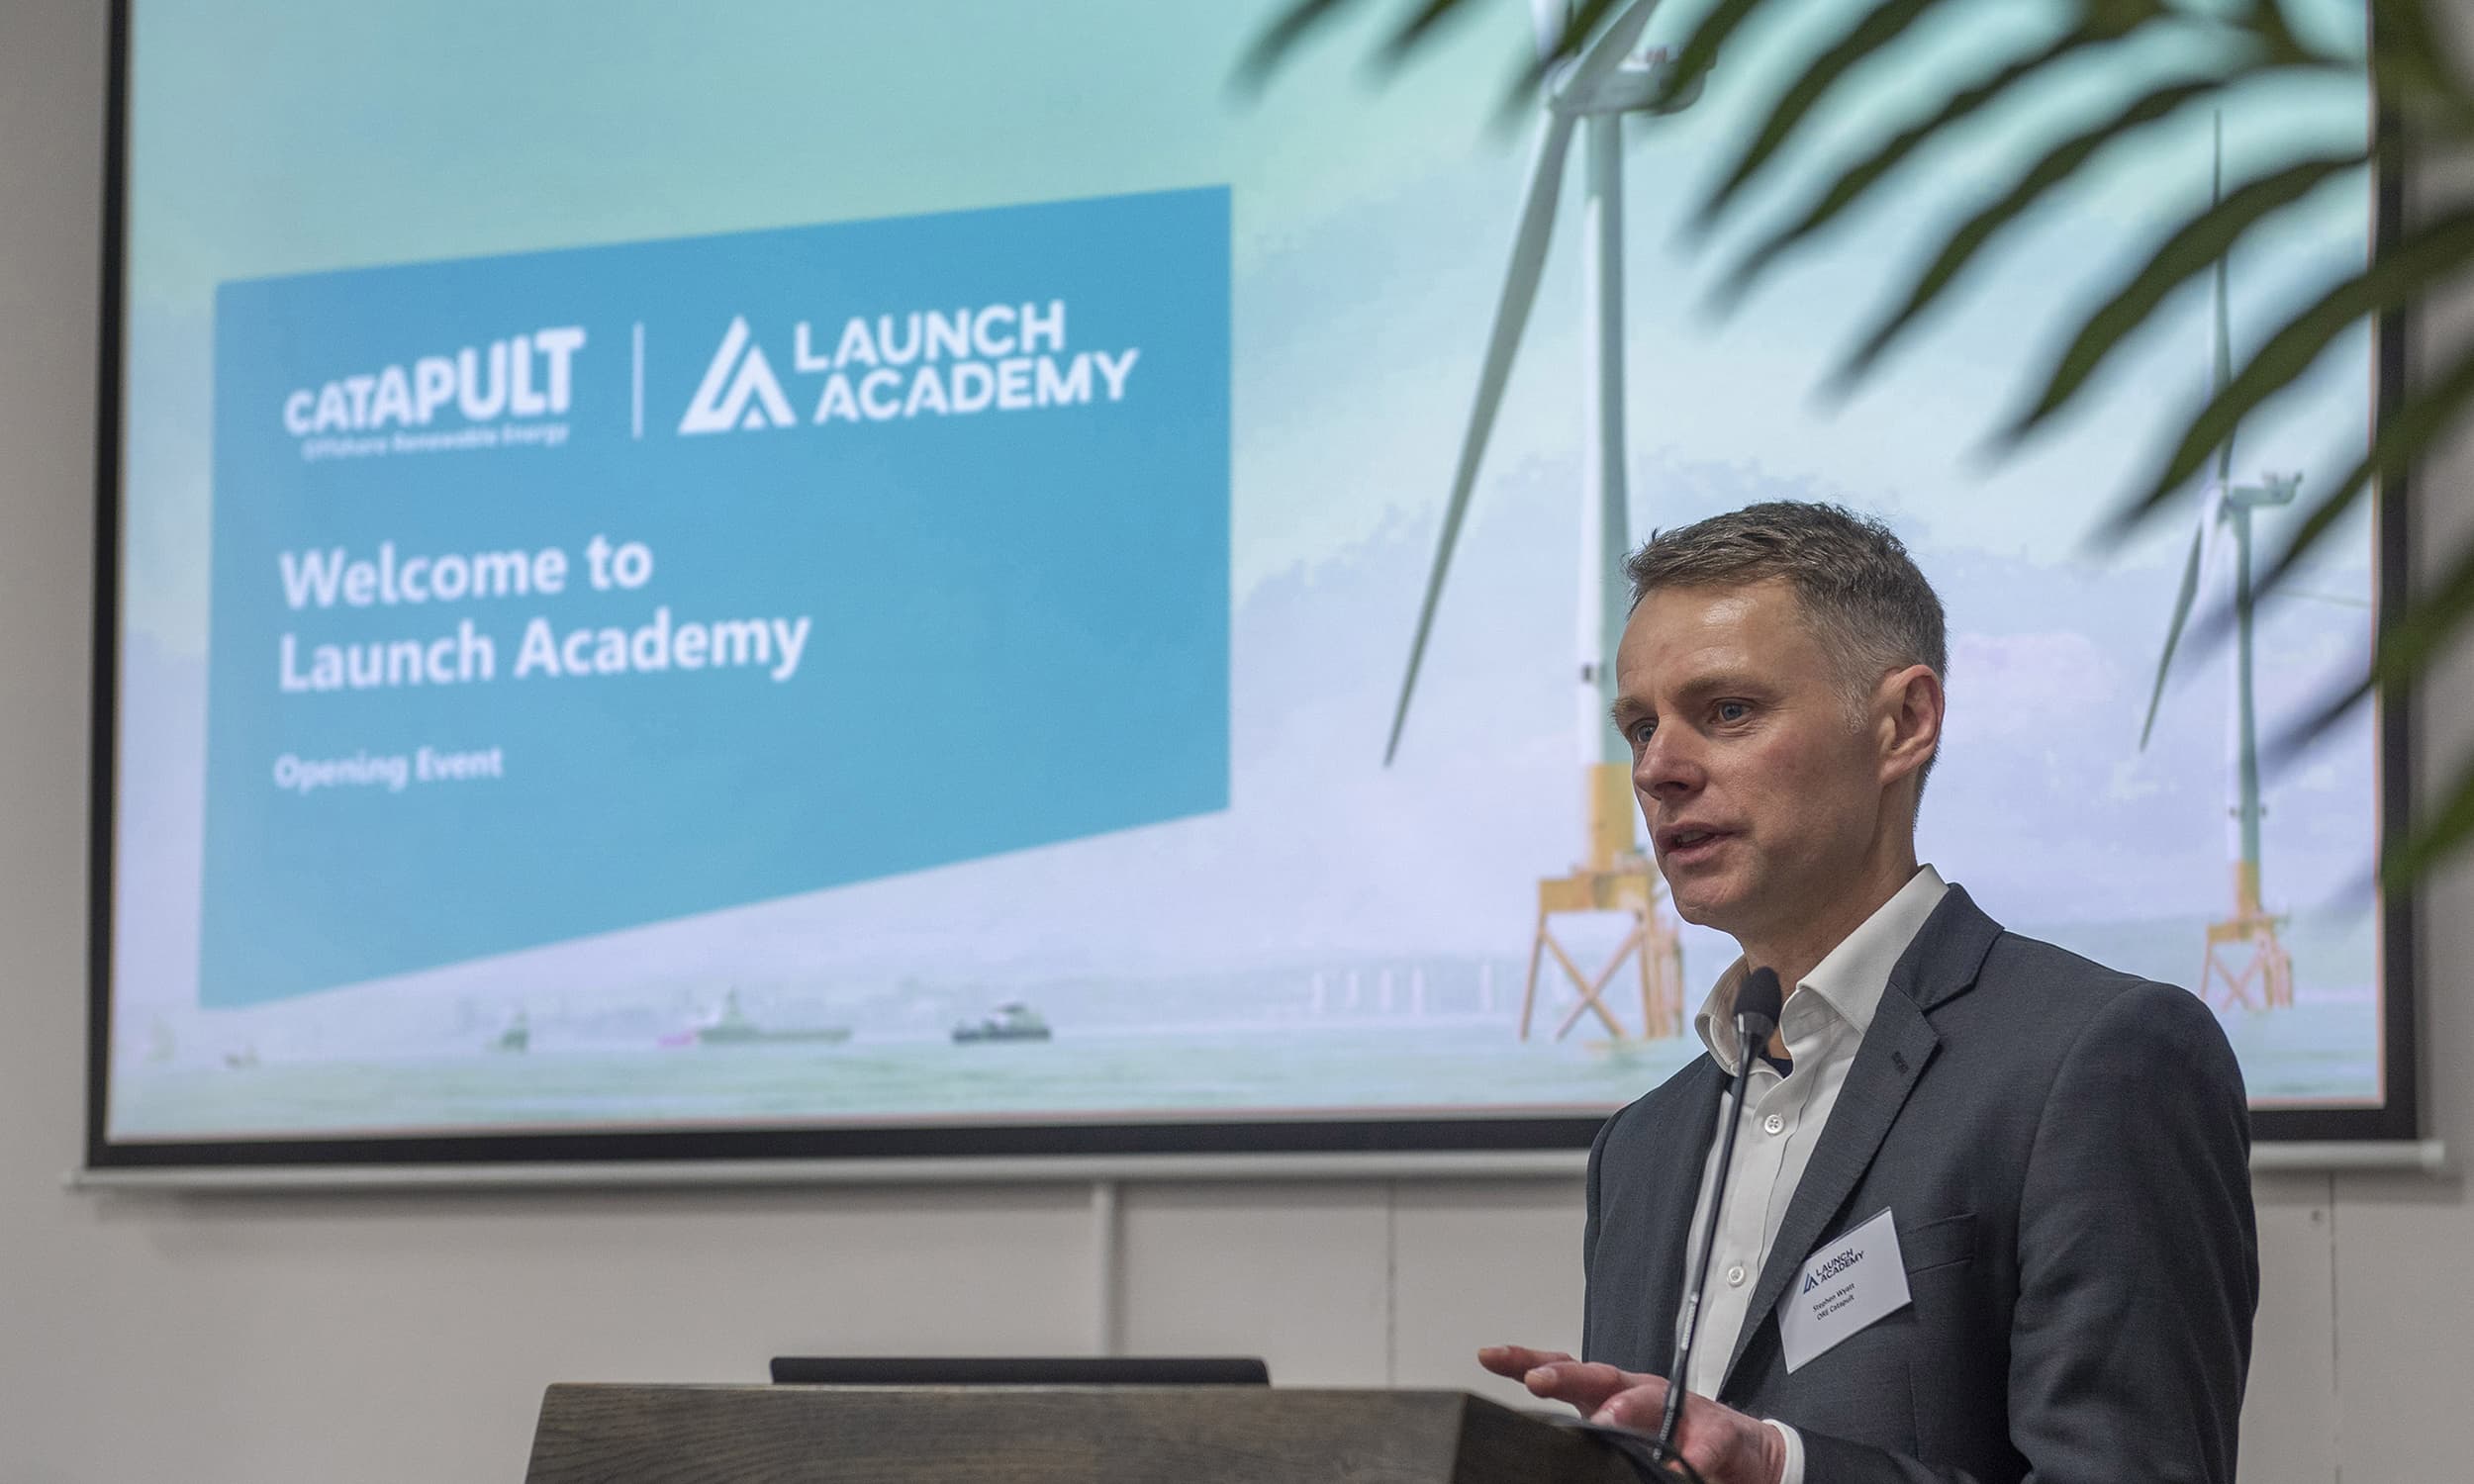
LAUNCH ACADEMY
LATEST REPORTS & RESEARCH PAPERS
Our reports and research papers are designed to provide you with relevant analysis and insight on key industry issues.
They cover a broad range of topics – including economic analysis, O&M best practices, financial modelling, electricity distribution system mapping, cyber-security requirements, and much more.

JOIN THE TEAM
Are you looking to join the ORE Catapult team? You can see all of our careers and open positions here:


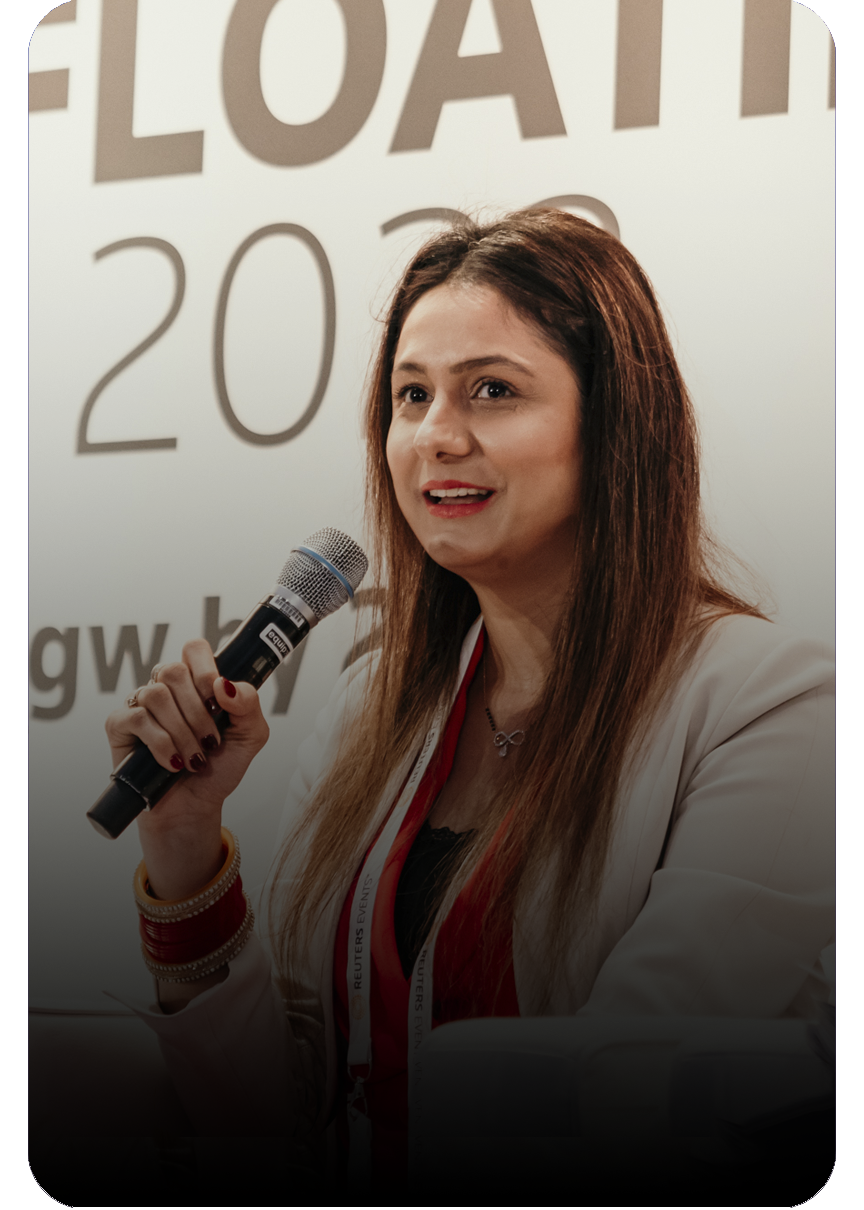
REENERGISE PODCAST
Episode 50: Floating Offshore Wind - The State Of Play 2024


